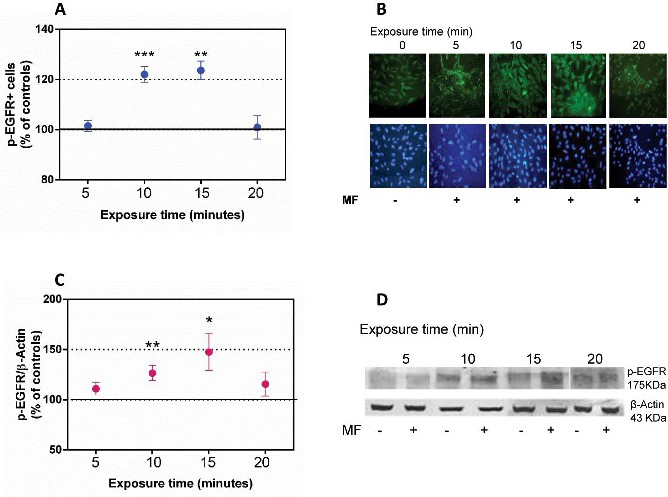
Fig. 2. Rate of phosphorylated EGFR-positive cells (p-EGFR+) and Western blot quantification of p-EGFR expression, after different MF- or sham-exposure intervals. (A) Immunocytochemical and computer-assisted image quantification of the rate of p-EGFR+ cells. Each point represents the mean ± SEM of 4 experimental replicates, with 8 samples (4 MF- and 4 sham-exposed) per replicate. Values are normalized over controls (line 100%) **: 0.001 ≤ p<0.01; ***: p<0.001 (ANOVA and Student's t-test). (B) Upper panel: Representative images of p-EGFR labeling at the time intervals assayed. Lower panel: Hoechst-stained nuclei of the cells in the corresponding upper micrographs. MF-: sham-exposed controls; MF+: samples exposed to the MF for 5 to 20 minutes. (C) Western blot quantification of p-EGFR expression using β-Actin as load control. The values, normalized over the corresponding sham-exposed controls, are means ± SEM of at least 4 experimental replicates per exposure time, with 6 samples (3 MF- and 3 sham-exposed) per replicate. A total of 114 samples were analyzed. *: 0.01 ≤ p<0.05; **: 0.001 ≤ p<0.01 (Student's t-test). D) Representative blots at the different exposure (MF+) or sham-exposure (MF-) intervals.